|
|
|
|
|
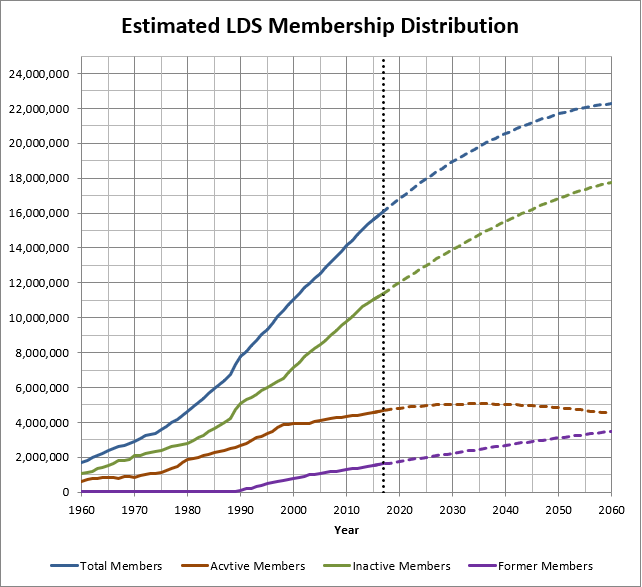
Total Membership Definition: Total membership refers to the total number of individuals on the records of the LDS church as members at the end of each given year. This includes individuals who have been baptized, as well as children since 1989 who were added to the records of the church without baptism while under the age of 8. It excludes members whose names have been removed due to resignation, excommunication, death, or having reached the age of 110. Total membership at the end of every year from 1830 to 2011 is reported in the 2013 Church Almanac published by Deseret News, pages 210-213. Total membership at the end of every year from 1934 to 2016 has been published in the general conference (annual statistical) reports. The values for the overlapping years (1934-2011) align except for 1972, 1973 1974, 1990, 1995, 1998, 1999, and 2001, in which the values from either source differ by less than 1%. For the purposes of this analysis it is assumed that the general conference annual statistical reports provide the more accurate numbers. Total membership is shown in Figure 1a. 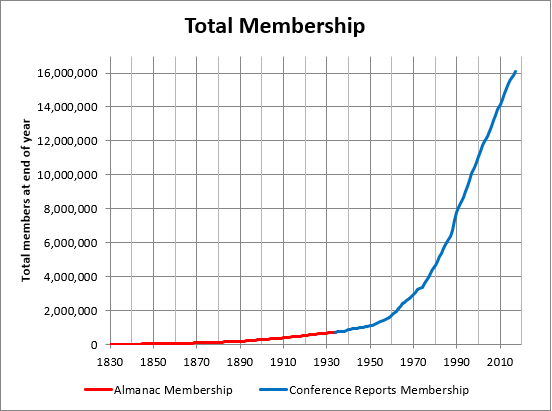
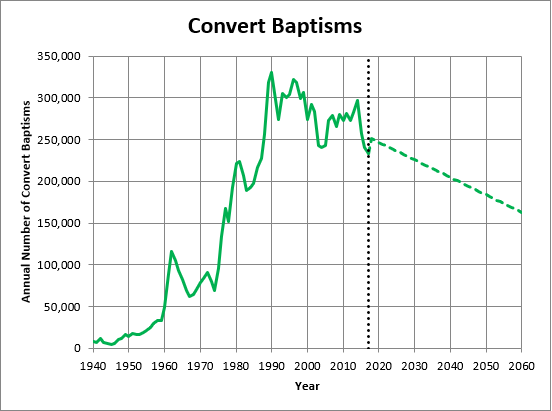
Convert Baptisms Definition: It is assumed that convert baptisms refer to individuals age 9 and above whose names are added to the LDS church in association with their baptism. This number has been reported consistently since 1921. In 1910 and 1918, total baptisms were reported, and in 1913 the baptismal rate was reported. These latter values appear to be the sum of convert baptisms plus baptisms of children of record, as seen in Figure 1b. Therefore, in order to obtain convert baptisms, the baptisms of children of record must be subtracted from the totals. 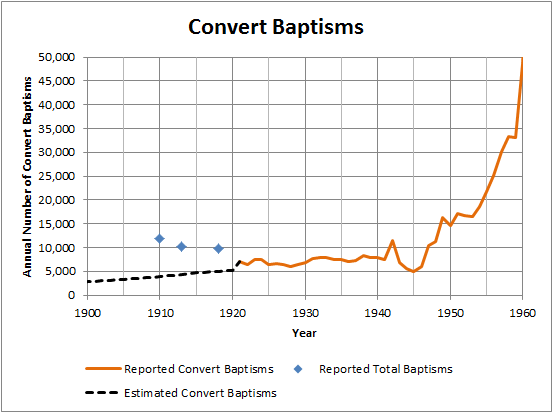
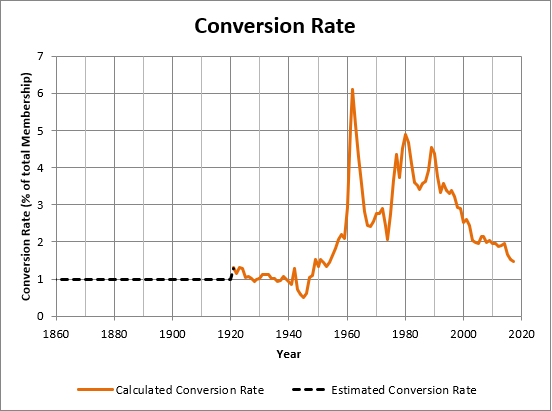
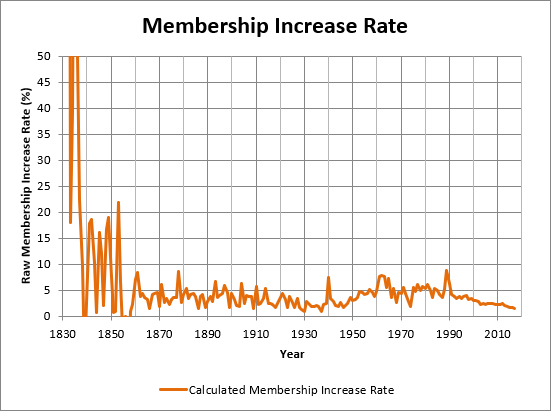
From 1920 to 1950, the annual conversion rate per total membership held steady near one percent, as seen in Figure 1c. This means for every 100 church members a new convert was baptized every year. Although the conversion rate prior to 1920 is unknown, the percent rate of increase of total membership was chaotic for approximately the first 30 years since the church was organized, as seen in figure 1d, with massive periodic gains and losses. The rate of increase became semi-stable around 1859.
Given the stability of church growth since 1859, it is assumed that a conversion rate of approximately one percent can be extrapolated back to 1859. Given the annual membership totals, this yields an estimated number of convert baptisms from 1859 to 1920. Prior to 1859, a number balance is required to estimate the number of convert baptisms, assuming rates of name removal, which will be discussed near the end of this report. This yields Figure 1e: 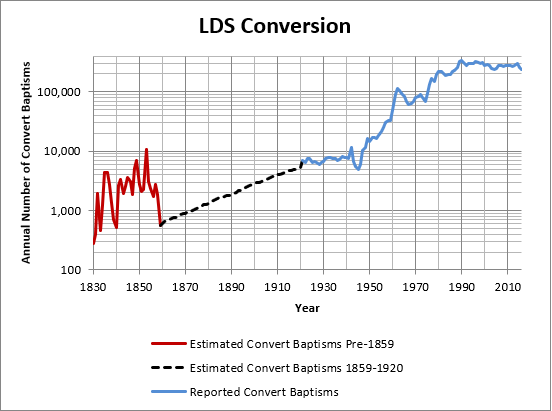
Definition: Children age 0-7 who are part of a family that has joined the LDS church through conversion, but are not baptized. It is assumed that the average convert falls within the current U.S. Age Distribution, which is relatively constant across age ranges. Based on this distribution, it is assumed that the number of convert children of record is roughly equal to 11.71% of the number of convert baptisms. This is based on the assumption that 10.35% of the population is below the age of 8, and 88.36% is above. Children age exactly 8 who are part of convert families are assumed to be lumped in with children of record baptisms.
Children of Record Definition: The number of children age 0-7 who are added to the records of the church without baptism, including children born to active members as well as convert children of record. Prior to 1989 these children were counted, but not included in the membership totals. Children of Record BaptismsDefinition: Children age 8 who are baptized. As discussed earlier, in 1910 and 1918 the general conference reports included "total baptisms," and in 1913 "baptism rate" from which total baptisms can be inferred. If baptism rate is assumed at 1% as discussed earlier, then subtracting the convert baptisms from this value yields children of record baptisms for 1910, 1913 and 1918 at 11,917, 10,298, and 9,801 respectively. Linear interpolation can be used to estimate between the known values. Increase in Children of Record has not been reported in a consistent manner over the years. In 1914, 1918, and from 1921-1981 the annual reports listed "children blessed." From 1982-1987 and from 1997-2014 it reported "Increase of children of record." Separate figures for "Children of Record Baptized" were given from 1921-1996. The increase of children of record can generally be related to the children of record baptized 8 years later. During the last such pairing for which both of these figures were reported, 1987-1995, this ratio was 71.86%. Using this relationship projected forwards, and linear interpolation to fill in the gaps, yields Figure 2a: 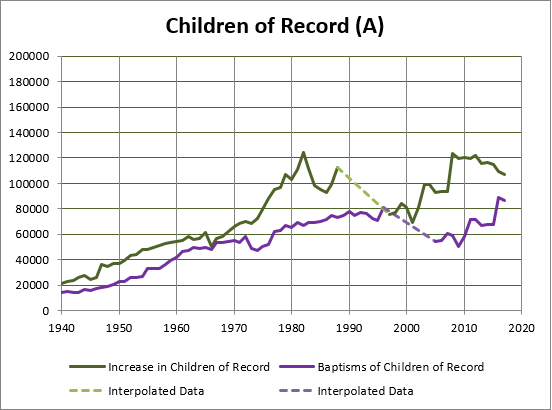
As seen, when the reports were changed in 1997 to "increase of children of record" as opposed to "children of record baptized," it intuitively appeared that the same statistic was being reported under a different name. Interpolation yields a sudden and inexplicable drop in both statistics. It can be assumed, for the sake of continuity of data, that starting in 1997 the LDS church reported children of record baptisms, but under the incorrect label "increase of children of record." This assumption carried to the present yields Figure 2b: 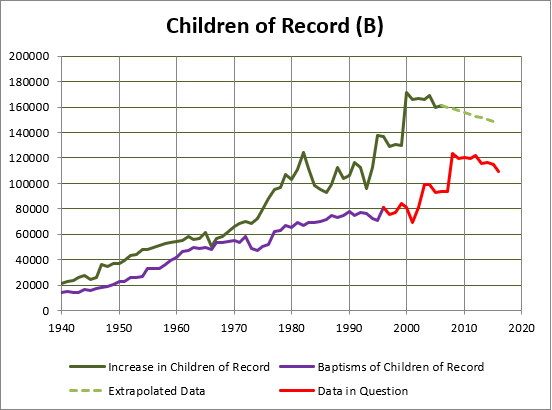
As will be discussed later, activity rates can be inferred by the number of children born into the LDS church. When that particular method is employed on the data in Figure 2b, it yields an activity rate by births for 2009 as being between 50% and 60%. An analysis of the data at cumorah.com reveals the average global activity rate of the LDS church in 2009 should have been approximately 30.5%, which is instead consistent with the children of record baptisms value shown in Figure 2a, which yields an activity rate of 32.1%. This indicates that in 2009 the data in general conference were reported correctly, which prompts us to seek a third explanation for the irregularity. In 2008 the values reported as increase of children of record took a sudden 30% increase, and have remained near that higher rate every year since. If it is assumed that this sudden increase represented the actual change from reporting children of record baptisms to increase of children of record, we obtain Figure 2c: 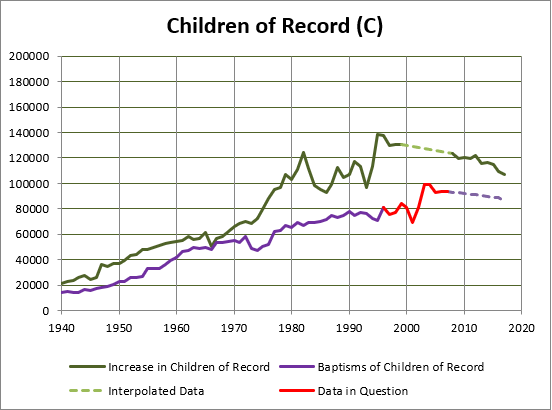
There are three reasons to accept Figure 2c as representing the most reliable interpretation of the data:
 Figure 2e 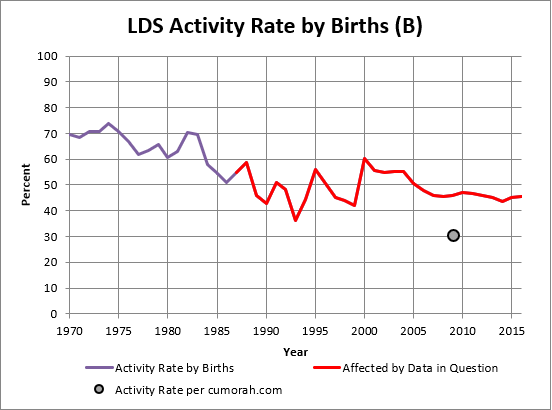 Figure 2f 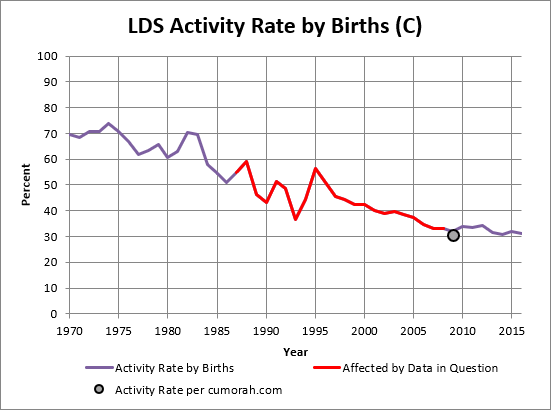
Increase of children of record prior to 1910 can be estimated by using conversion estimates described previously to estimate convert children of record, and adding that to recorded births, which is described in the next section. Children of record baptisms prior to 1910 can be estimated by taking the increase in children of record from 8 years prior, and adding one-eighth of the sum of the convert children of record from the preceding eight years times the activity rate (to account for retention of converts). These methods, combined with the method above, yield Figure 2g: 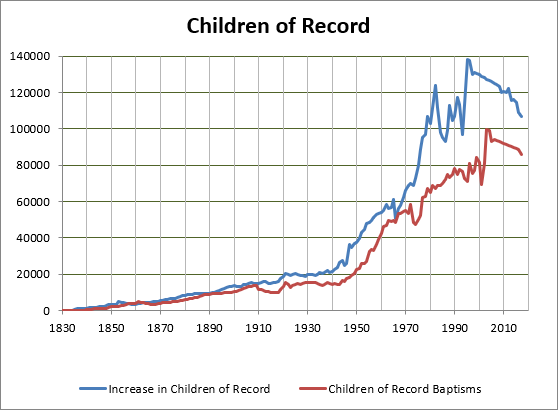
Recorded Births Definition: The number of children born to members of the LDS church, who are added to the records of the church. From 1914 to 2014, when increase of children of record is either known or inferred, recorded births are estimated by subtracting convert children of record from increase of children of record. This yields Figure 3a: 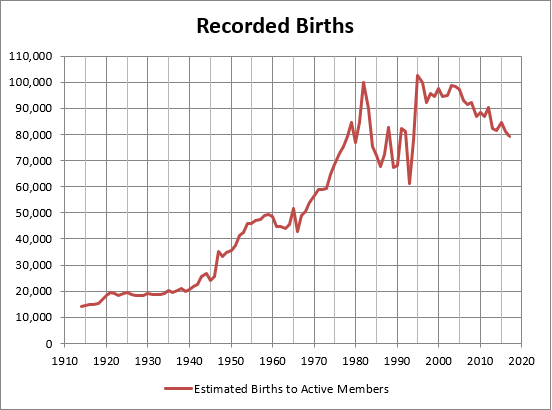
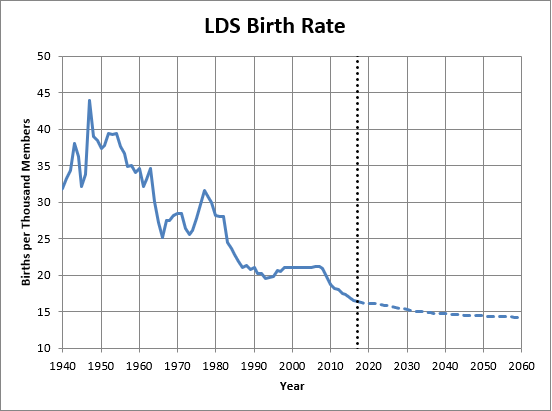
Birth rate is required to estimate recorded births prior to 1914. Birth RateDefinition: The number of births to all Mormons, active and inactive, per thousand members, regardless of whether or not the newborns are added to church records. The Mormon birth rate was first given as 40.2 in this report for 1908. It was then officially reported occasionally from 1910 to 1919, and consistently from 1920 to 1983. In 1983, the last year when the LDS church reported a birth rate, the reported rate of 24.5 per thousand was very near the Utah birth rate at the time of 24.7. Therefore, it is assumed that since 1983 the LDS birth rate has remained somewhat near the Utah birth rate, which can be found in this report, and at this website. Prior to 1908 the birth rate can be estimated using known number of births per woman, which are presented in Figure 4.5 of this report. Assuming the average woman married at 22, the number falling to 19 in the late 1800's due to polygamy, and rising to 23 by 1912, the average number of children born to each woman during her lifetime, for fertile mothers in any given year, can be estimated based on the values for the range of mothers born the number of years prior to the given year equal to the current Mormon life expectancy, which will be discussed later, and 19-23 years prior to the given year. Dividing that number by the range in fertility years for the women yields approximate number of children born to each woman that year. The proportion of fertile women vs. non-fertile women is equal to the fertility range divided by life expectancy. The number of fertile women is equal to the total church membership times the fertility proportion times the ratio of women to men, which can be computed from the total number of women and men recorded by the Federal Census Bureau. Those data can be found in full here. The number of actual women bearing children is the number of fertile women times some unknown factor. The factor of children born to each birthing woman is the lifetime number of children born to women, estimated using the average described above, divided by the fertility span in years. The birth rate, then, can be estimated by multiplying the number of women bearing children by the factor of children born to each woman, times one-thousand, divided by total membership. In the final equation, the total membership and range of fertility cancel out, leaving only the ratio k unknown. 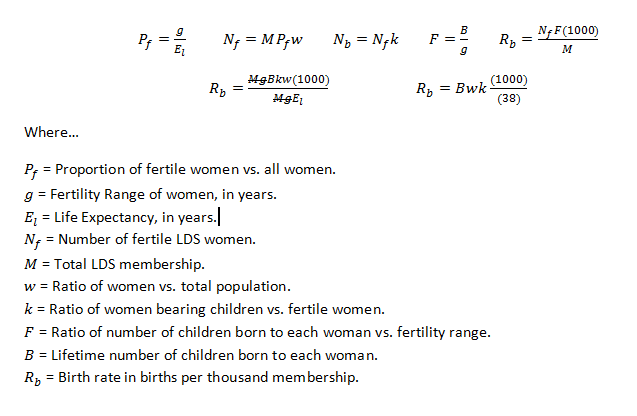 Because the birth rates for 1908, 1910, and 1911 are known, the ratio k can be estimated, and is found to be very near 0.7, which yields 39.5, 39.0, and 37.2 respectively, while the reported rates for those years are 40.2, 38, and 38 respectively. The resulting birth rate for all years is shown in Figure 3b: 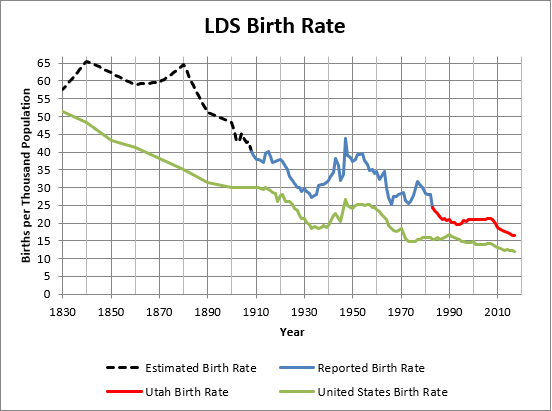
Using these birth rates, and assuming 100% of all births to Mormons were recorded prior to 1914, which will be discussed later, the number of recorded births prior to 1914 can be estimated, completing our estimate of number of recorded births, shown in Figure 3c: 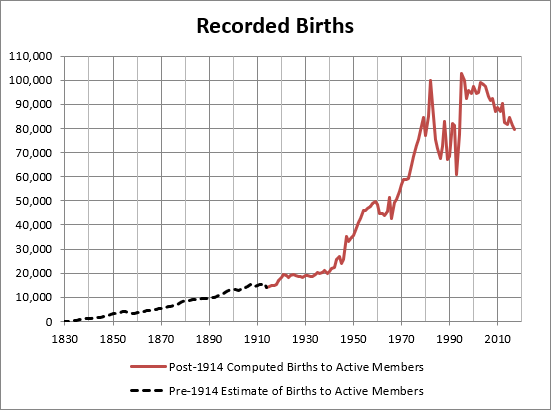
Activity Rate Definition: The proportion of members of the LDS church who are routinely participating in church services. There are multiple ways the activity rate can be estimated, each of which helps in making the best overall estimate. Activity Rate by BirthsDefinition: The proportion of members of the LDS church who are adding their children to the records of the church vs. total membership. The activity rate by births can be estimated by dividing the rate of children actually being added to the records of the church by the birth rate. The difference between the two is shown in Figure 4a: 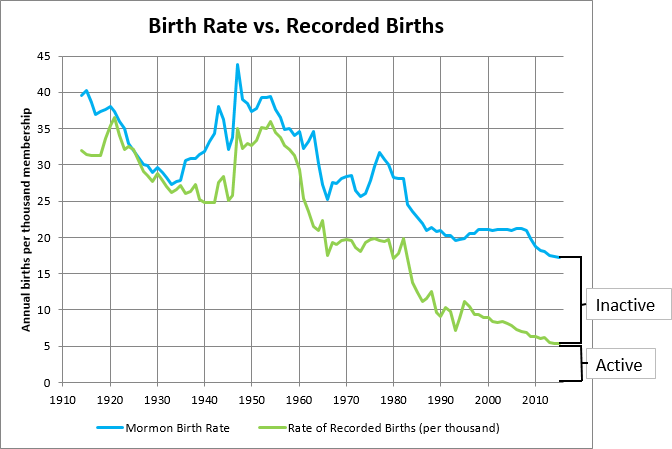
During World-War-I and World-War-II, a significant number of Mormons were sent overseas, resulting in what can be seen as periods of lower than usual activity rates. Because increase of children of record wasn't first reported until 1914, the year of the beginning of World-War-I, it can be assumed that the data set began with an atypically low activity rate. Because the proportion of people adding their children to the records comes very near to 100% in the period between the wars, remaining in the high-90s, it is assumed that for all intents and purposes 100% of Mormons were adding their children to the church records prior to 1914. The activity rate by births, therefore, is as shown in Figure 4b: 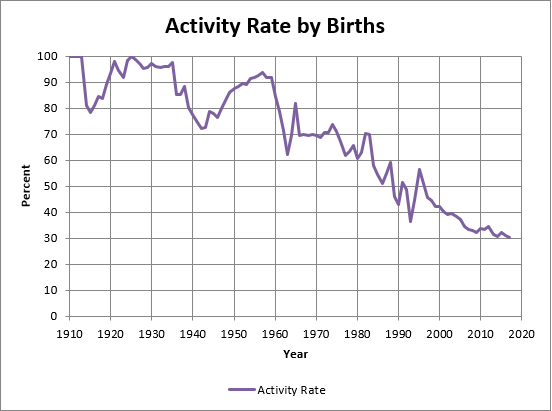
It is assumed that activity rate by births will typically overestimate overall activity rates, as it is more likely that an inactive member will have their children added to the church records than it is that an active member will not. Therefore, activity rate by births is used as an upper boundary for overall activity rates. Activity Rate by Seminary Enrollment Definition: The proportion of members of the church aged 15-18 who are enrolled in seminary. The activity rate by seminary enrollment can be estimated by dividing the total seminary enrollment by the total number of church members between the ages of 15 and 18. Seminary enrollment values by year up to 2011 can be found in this report. This article provides the number for 2013, which allows 2012 to be interpolated. Institute enrollment figures are also known, but without knowing the exact age range of the students it is impossible to use them to estimate activity. Nevertheless, seminary and institute enrollment are shown together in Figure 4c: 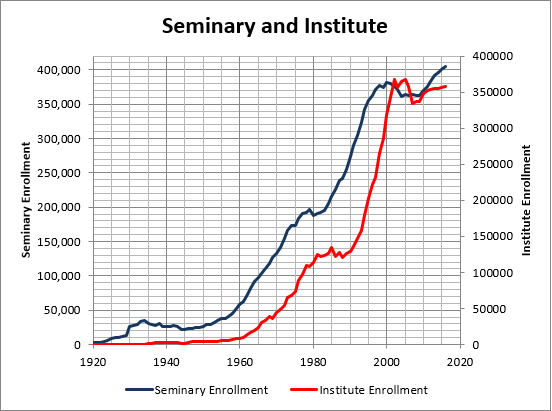
Growth patterns for seminary and institute lend credibility to these numbers, with peaks in seminary enrollment growth occurring 14 years after each baby boom, and institute growth peaking 4 years after each peak in seminary growth, as shown in Figure 4d: 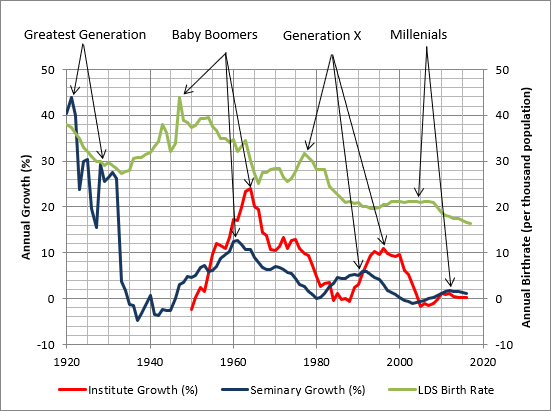
To estimate the number of church members at any given age, simply add the number of recorded births for the corresponding prior year, 1/8 of the total number of convert children of record for the ensuing 8 years, and 1.33% of the convert baptism totals for each year thereafter (based on the U.S. age distribution already discussed). This method yields the totals shown in Figure 4e: 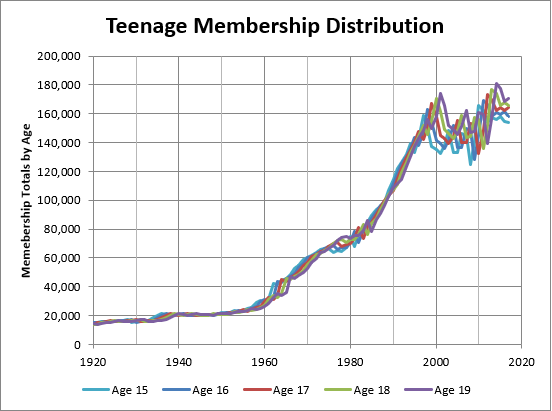
Dividing annual seminary enrollment by the sum of all members aged 15-18 yields the activity rate by seminary enrollment, shown in Figure 4f: 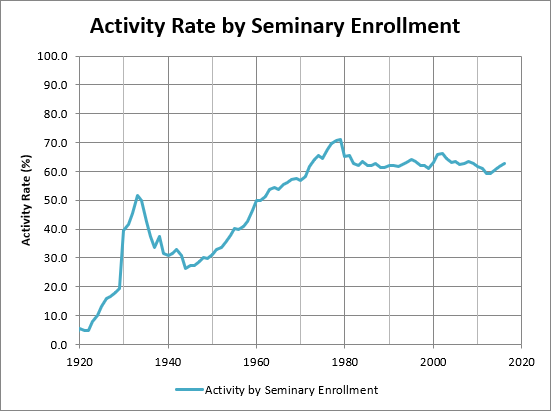
It is assumed that activity rate by seminary enrollment will typically overestimate overall activity rates, as it is more likely that an inactive member will be enrolled in seminary than it is that an active member will not. Therefore, activity rate by seminary enrollment is used as an upper boundary for overall activity rates. Activity Rate by MissionariesDefinition: The proportion of young men of the appropriate age who become missionaries. The activity rate by missionaries can be estimated by dividing the total number of young men entering the mission field each year by the total number of male church members aged 19 prior to 2013, and aged 18 from 2013 forward after the change in minimum missionary age took effect. Because it is not expected that all active women go on a mission, number of young women going on missions can not be used to estimate the activity rate. The number of total missionaries entering the field was reported in the annual statistical report from 1926 to 1965. The 1926 report also included values for 1919 and 1925. However, the church almanac, which contains values that are published here, reports the number of missionaries entering the field for all years up to 2011. The values from the church almanac do not match the values from the annual statistical report in most cases where such data exist, but for the purposes of this analysis the almanac value are assumed for every year due to completeness of data. In the absence of published data of any kind, new missionary totals after 2011 must be estimated using a number balance rolled over from previous years. New missionaries entering the field are charted in Figure 4g: 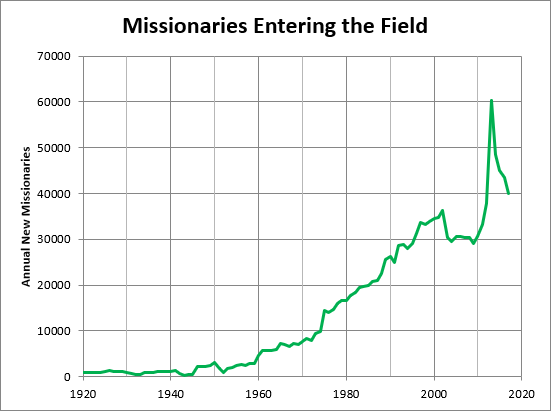
Many of the missionaries entering the field are senior couple missionaries. The earliest known references to senior missionaries date to the late 1970's. Between 1974 and 1975 there was a sudden increase in new missionaries entering the field of 47%, and the numbers remained high thereafter. For the purposes of this analysis, it is assumed that there were no senior missionaries prior to 1975. The total number of senior missionaries is unknown prior to 2005, when it was reported in this article that there were 2,100 couples, which equates to 4,200 missionaries. In September of 2011 it was reported in this article that there were 4,244. That article also announced new policies that would make it easier for senior Mormons to serve missions. According to this article, the number had risen to 5,778 by the time the change in the ages of young missionaries was announced, which was October 2012. By the end of 2013, this article states that senior missionaries made up 8% of the total missionary forces, which calculates to approximately 6,643. By February 2015, according to this article that number had fallen to 6,609. However, that article also stated that the current number of total missionaries was 83,471. The statistical report for the end of 2014 stated that the number of total missionaries was 85,147. If you scale the number of senior missionaries to that value, you get approximately 6,742. In 2015, according to this article the number had fallen to 6,200 by 2015. For the purposes of this report, it is assumed that the number of senior missionaries for 2005, 2010, 2011, 2013, 2014, and 2015 are 4,200, 4,244, 5,778, 6,643, 6,742, and 6,200 respectively. These values for 2005 and 2010 indicated that approximately 1% of total active Mormons, discussed later in this report, were senior missionaries. Thus it is assumed that from 1976-2009, for all years where we don't have data, the number of senior missionaries was 1% of total active Mormons. After the 2011 policy change this proportion appeared to increase to 1.2%, which is assumed for all years after 2014. The assumption that 2,000 senior members became missionaries in 1975 adequately accounts for the initial surge seen in the total new missionaries that year, and the value for 2012 can be interpolated between the values for 2011 and 2013. Based on these assumptions, total senior missionaries are shown in Figure 4h: 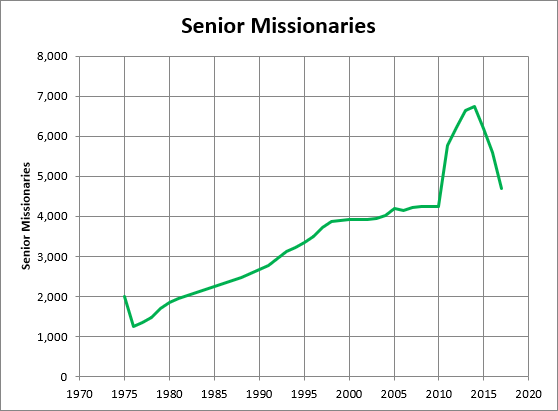
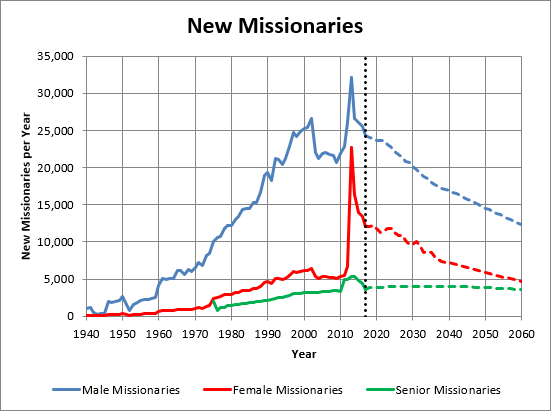
According to various published statements by the LDS church, the proportion of male missionaries to female missionaries up to 2012 was approximately 5.5 to 1, respectively, and after 2012 this respective proportion changed to 3 to 1. Knowing that female missions are 75% the length of male missions, and subtracting new senior missionaries from total new missionaries (based on the assumption that the average senior mission is 15 months long), it must be assumed that 80.5% of the remaining missionaries were male in order to achieve this proportion prior to and including 2012. According to this article, in 2013 64% of all missionaries were elders, and 28% were sisters, which comes out to approximately 53,142 and 23,250 respectively. A number balance on total missionaries versus new missionaries reveals that the average mission length is 91.3% of the required mission length, or 24 months for men and 18 months for women. With this in mind, knowing the total number of male missionaries in 2013, the number of new male missionaries that year can be back-calculated. If it is assumed that female missionaries make up the remainder of new missionaries, then for 2014-2016 it must be assumed that young men go on a mission at a rate approximately 5% higher than the final activity rate, discussed later, in order for the total number of female missionaries to be approximately 20,000 in 2015, as reported in this article. Using these assumptions, the number of new missionaries, broken down by male, female, and senior, can be calculated, and are shown in Figure 4i: 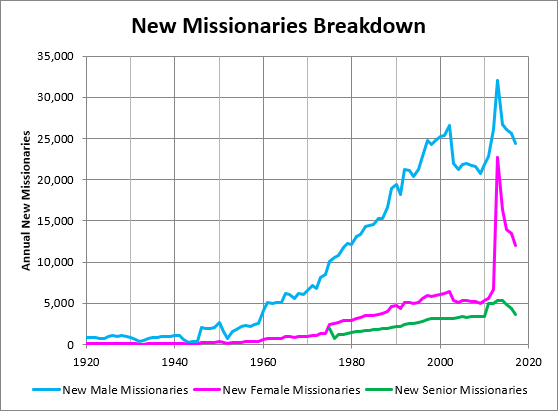
The activity rate by missionaries is obtained by dividing the number of new male missionaries each year by half of the total number of 19 year-olds, which yields figure 4j: 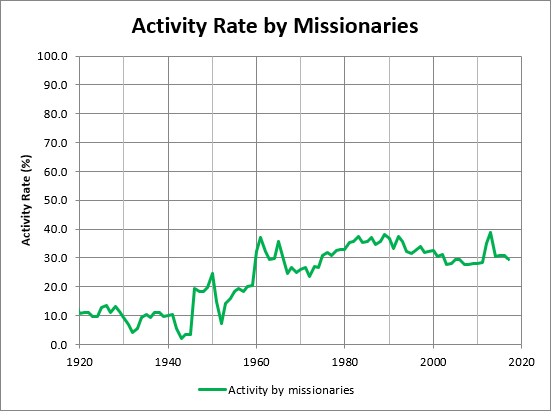
It is assumed that activity rate by missionaries will typically underestimate overall activity rates, as it is more likely that an active member will not go on a mission than it is that an inactive member will. Therefore, activity rate by missionaries is used as a lower boundary for overall activity rates, with the exception of the years after 2011, where the values are known to be high. Activity Rate by Wards and StakesDefinition: The proportion of the average number of active members in wards or stakes to the average number of total members in wards or stakes. Assuming that the average number of active church members in the wards and stakes has not changed, the activity rate by Wards and Stakes can be estimated by dividing this constant number by the average number of total members in the wards and stakes across the church.
The number of stakes in the LDS church was reported sporadically in the annual general conference reports from 1909 to 1920. It has been reported consistently since 1921. It has also been reported for every year from 1830 to 2011 in the 2013 Almanac, which aligns with the general conference reports for all but ten individual years. The greatest discrepancy is 1949 when the general conference report gave 179 stakes, and the almanac reads 175. For the purposes of this analysis the almanac is used for all years. Similarly, the number of wards in the LDS church was reported sporadically in general conference from 1909 to 1923, and consistently from 1924 to 1989. From 1990 to the present, only the total number of wards and branches combined has been reported. The 2013 almanac does not list total numbers of wards, but it does list total wards and branches combined in the stakes, and because in 1909 the difference between wards and wards and branches in the stakes was only 3, it can be assumed that for all years prior to 1909 there were no branches in the stakes, and therefore the values for wards and branches in the stakes is identical to total number of wards. The present number of wards is continuously updated at this web page, along with the present number of branches. This site has been tracked continuously since November 2015, as shown here, and thus these data can be used for all years subsequent to and including 2015, with the understanding that the total wards and branches reported therein are always 97 lower than the number in the General Conference reports. The number of wards for each year from 1990 to 2014 must be estimated using a multi-variate interpolation, adhering strictly to the total wards and branches, and tying into the known values at each end. The resulting numbers of wards and stakes are shown with separate Y-axes in Figure 4k: 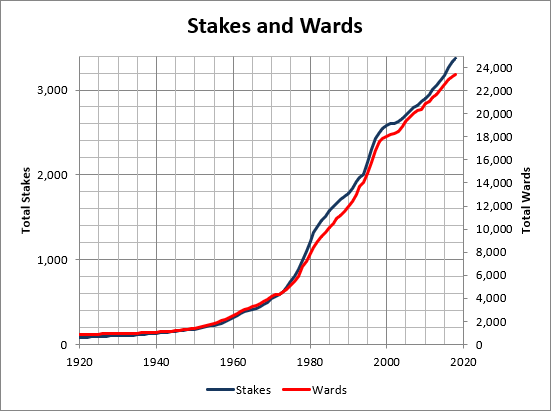
In order to estimate the number of members per ward and stake, the total number of members within the stakes alone must be known (excluding the members located within the missions of the church). This number was given in the annual general conference reports consistently from 1934 to 1976. In 1924 the number of total members within the missions was reported, allowing the total number of members within the stakes to be computed by subtracting this value from the total church membership. Values between 1924 and 1934 can be interpolated, values prior to 1924 can be roughly estimated using the total number of stakes and missions as a guide, but most importantly, values after 1976 can be extrapolated based on the known number of mission branches provided by the 2013 Church Almanac, and the average number of total members per branch. For 1934 to 1976 when we have given data, the average number of members per branch in the missions of the church reached 285, taken by dividing the total number of members in the missions by the total number of branches in the missions. Thus, for years after 1976, the total number of members in the missions can be estimated by multiplying the number of branches in the missions by 285, and that can be subtracted from the membership totals to yield number of members in the stakes. Because many members within the stakes are in stake branches, the total number of members in the wards alone must be separated from the overall figure. If it is assumed that branches in the stakes are of the same size as branches in the missions, ie. 285, then a number balance reveals that by the end of the years for which we have good data (1934-1976) the average total ward size reached approximately 550. Because total members per ward and branch will fluctuate with activity rates, they can not be trusted wholesale. However, they do form a ratio that can be used to divide the total number of members in the stakes into the branches and wards respectively, according to the total number of branches and wards within the stakes, and this can be used to take the number of members in the stakes of the church and estimate the number of members within the wards alone. The resulting average number of total (active and inactive) members per ward and stake are shown in Figure 4l: 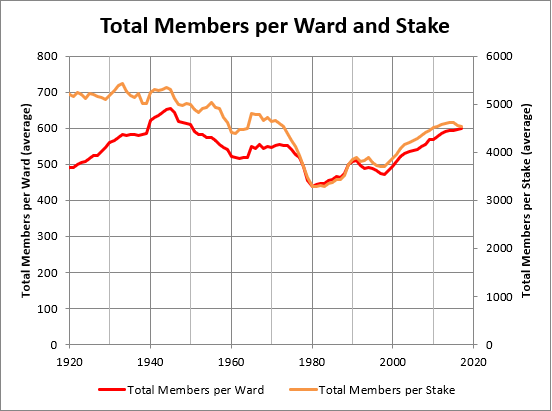
It is commonly thought that there are roughly 175 active members per ward. When this value is divided by the 2014 estimate of 540 members per ward, that yields an activity rate of 29.5%. Because this is very close to the 2014 activity rate estimates of 30.8% from the recorded births, and 29.8% from the departing missionaries, 175 is accepted as the average number of active members per ward. Similarly, 1350 is assumed to be the average number of active members per stake as it yields a 2014 activity rate of 29.4%. These numbers can then be divided by the total number of members per ward and stake for every year to yield activity rates, which are shown below in Figure 4k. Activity Rate by Sunday School Attendance Definition: The percentage of total members who attend Sunday School, on average, as per the annual reports from 1954-1970. A direct calculation of activity rate can be made for the years 1954 through 1970, in which average Sunday School attendance was reported in general conference, by dividing this value by the average overall membership during the year. These values, overlaid with activity rate estimates using the other methods described previously, including the 30.5% activity rate in 2009 estimated by cumorah.com, yield Figure 4k: 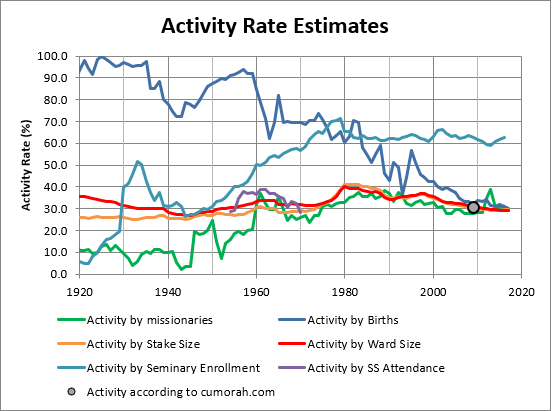
Final Activity Rate Estimate Knowing that the activity rates estimated using the birth and seminary enrollment information are expected to be high, and that the activity rate estimated using the number of young men who go on missions is expected to be low, a range of likely values can be assessed. Figure 4l shows this range, with the unlikely values blocked out: 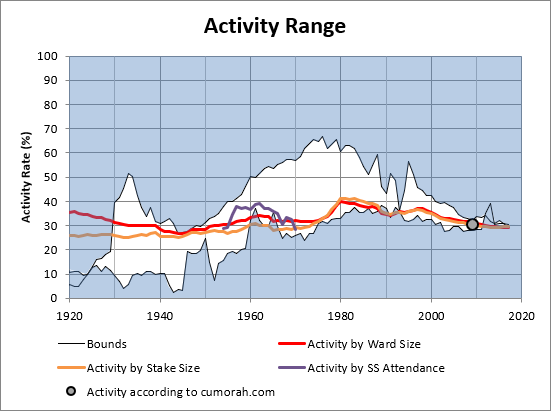
As seen in the above graph, activity rate estimates using ward size, stake size, and Sunday School attendance track generally within the expected range all the way back to 1930 when seminary began to be commonplace, and since none of these estimates is expected to be high or low, it is reasonable to assume some combination for the overall activity rate. Because it is a direct measure, activity rate by Sunday School attendance is assumed to be the most accurate. However, since coverage is limited, it needs to be supplemented by other data for years prior to 1954 and after 1970. While the number of and total membership within stakes is known with better precision, wards are a more attractive option for estimating these unknown activity rates because of size stability. Estimating activity rates for either wards or stakes requires the assumption that the average number of active members per unit has not changed over the years, and while wards have always been a single unit of relatively standard definition and structure, stakes have no known restrictions as to how many wards they can contain, which might create wide variation in average size over time. The variables with the highest uncertainty in the computation of activity rates by ward size are the total number of members in the stakes of the church, and the average number of members in the branches of the stakes (both of which are required to estimate members in the wards). A sensitivity analysis can be performed on these two variables to determine their significance to the overall activity rate estimate by ward size, which yields 29.5% for the year 2014. As mentioned above, the total number of members in the stakes is estimated by subtracting the total number of members in the missions from the overall church membership totals, and the total number of members in the missions is estimated by multiplying the number of branches in the missions by 285. If the number of members per branch is raised to 400, then the total number of members in the missions rises from 1.1-million to 1.5-million, and the effect on the activity rate estimate for 2014 is that it rises to 30.4%. If it is lowered to 200, then the total number of members in the missions in 2014 becomes 0.7-million and the activity rate estimate for 2014 falls to 28.9%. Either way, this variable is not seen to be sensitive toward the overall activity rate estimate, since nearly doubling the branch sizes in the missions only affects the activity rate by 1.5%. As described above, it is also assumed that the average ratio of members in the wards to branches within the stakes is 550-285. If this ratio is changed to 550-550, meaning if it is assumed that branches and wards are the same size, the activity rate estimate for 2014 rises to 31.7%. If this ratio is changed to 550-0, meaning if it is assumed that there are no members in the branches of the stakes, the activity rate estimate for 2014 falls to 27.2%. Therefore, the assumption of an average branch size of 285 total members is also not seen to be sensitive toward the overall activity rate estimate. Based on these two combined sensitivity analyses, the activity rate estimate by ward size can be assumed to be accurate to within approximately 2%. Only a rough approximation of activity rates can be made for years prior to 1910 when the first statistical report in general conference was given. Based on death rates and name removal, to be discussed later, and the activity rates already computed, the number of active members who newly become inactive each year can be estimated, and is found to average approximately 2.4% of the total church membership. One important event in church history with this regard is the Mormon Reformation, in which any member who did not agree to be baptized was stricken from the church. This occurred in 1857, and as such it is assumed that by the end of this year, the total number of inactive members was only as many as went inactive following their rebaptism, or half of the typical number that went inactive in a typical year, meaning 1.2% of the total church membership. This reduction in inactive members is confirmed by the fact that the reported total number of members fell by over 8,000 between 1856 and 1857. A similar drop of over 4,000 is seen between 1854 and 1855. If the 2% trend is assumed consistently starting with 1.2% in 1857 and moving forward, the total number of inactives in 1909 becomes approximately 60,000 less than the computed value in 1910, whereas a difference of around 10,000 is expected. The percentage of members going inactive each year must be raised to 3.1% of total annual church membership in order to align with the post-1909 data, and the total number of inactive members in 1857 is accordingly raised to 1.55%. The resulting combined graph of activity rate is shown in Figure 4m: 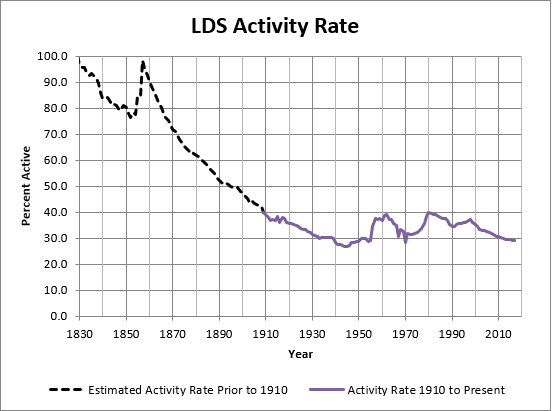
Definition: The proportion of members of the LDS church who die annually vs. total membership. With the exception of 1912, 1916, and 1919, the LDS death rate was consistently reported from 1910-1983. This is shown in Figure 5a with respect to the United States death rate: 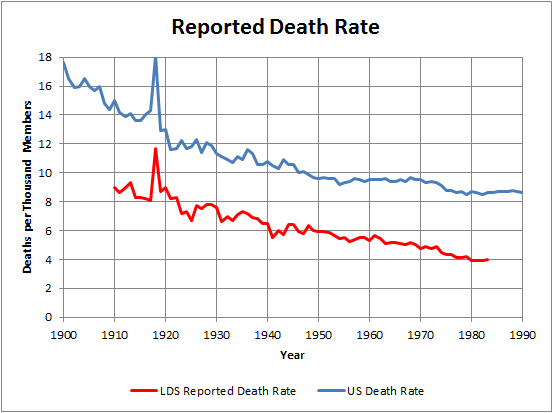
Definition: The average age of death at birth of the population, in years. In the absense of other data sources, it is assumed that Mormon life expectancy is similar to the U.S. life expectancy for white people. The U.S. life expectancy for white people from 1850 to 1900 is given in this study, and from 1900 to 1998 here, which is part of this research paper. These figures can be validated and extended past 1998 in this report by the Center for Disease Control and Prevention. Life expectancy prior to 1850 is assumed to be the same as the 1850 value, or 39.5 years. In 2004 two studies were completed on Mormon life expectancy, one for California Mormons, and one for Utah Mormons. They yielded life expectancies of 84.1 and 79.8 respectively, both above the United States average of 77.8. This gives us a baseline for deviating from the U.S. computed value. The results of these assumptions yields Figure 5b. 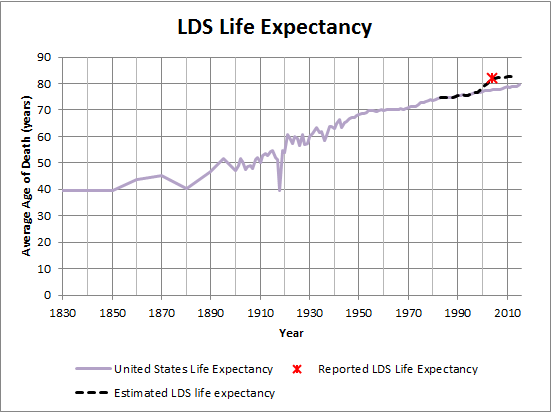
Given life expectancy, the final death rate for all years for which we do not have data can be estimated based on what is known by LDS age distribution characteristics. Populations with a higher average age are expected to die at a higher rate than populations whose average age is lower. Over the course of its existence, the LDS population has spanned both categories. In the early days of the LDS church the membership was made up mostly of converts, who joined as adults, thus skewing the population to higher ages. This would have resulted in a death rate far above the U.S. average. After the LDS church moved to Utah, convert baptisms plummeted and birth rates rose, thus lowering the average age significantly, and with it the death rate. The LDS death rate by year can be estimated by separating the LDS population into three categories - those who were born into the church, those who joined as convert children of record, and those who joined as convert baptisms. It is assumed that the average age of convert children of record is 3.5, and the average age of convert baptisms is calculated using the equation below: 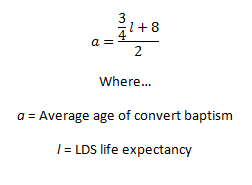
If you project backwards a number of years equal to the life expectancy minus the initial age of each of these three groups, the result is the estimated number of deaths for that year, which divided by the total membership yields death rate. However, knowing that life expectancy is an average, and that the standard deviation is approximately 20 years, a 40-year average is employed for the purposes of this analysis. However, it is also known that as age increases in the LDS church, activity rate declines. For instance, at age zero almost 100% of members are active, as well as convert baptisms at the moment they join the church, but over time the general trend is towards inactivity. Therefore the oldest members, who are those most prone to dying, tend to also be the least active, which means their deaths tend to go unnoticed. This means that the recorded death rate is expected to be lower than the actual death rate, which, in fact, is what is observed when the method of calculating death rate above is compared to reported death rates from 1910 to 1983. See Figure 5c: 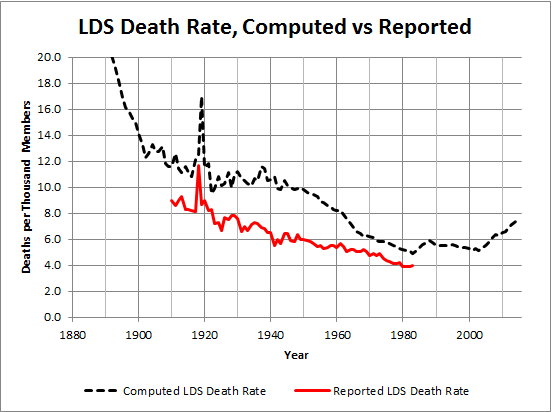
For the purposes of this analysis, reported death rate is desired rather than actual death rate, as that is what effects the membership statistics. Therefore, an adjustment must be made to the calculated death rate to bring it into harmony with the reported death rate. In 1910 the reported death rate was approximately 0.7-times the calculated death rate, and in 1983 this factor was approximately 0.8. Therefore, for all years prior to 1910 the calculated death rate is mupltiplied by 0.7, and for all years after 1983 it is multiplied by 0.8. This yields Figures 5d and 5e: 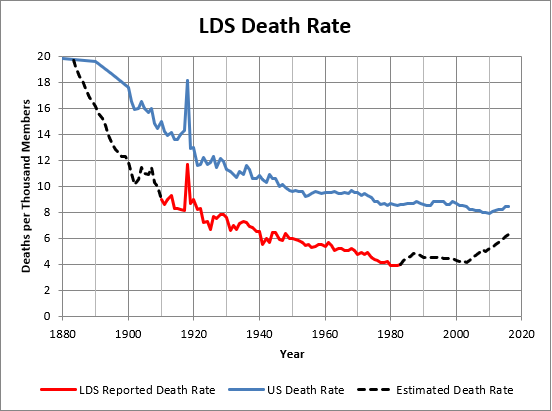
Inactives Who Reach Age 110 According to this article in the Salt Lake Tribune, Merrill Bateman, an LDS general authority, confirmed that, barring known deaths, names of members are not removed from church records until they attain the age of 110. It is assumed, then, that this applies to members who are not active. Total membership that attains the age of 110 for any given year can be estimated by adding the number of children born into the LDS church 110 years prior, plus one-eighth of the number of convert children of record added over the next 8 years, plus some sort of age distribution applied to convert baptisms for all subsequent years. It is assumed that convert baptisms favor individuals of lower age. Thus, to generalize the data, an even distribution of ages below 60 are assumed, resulting in the average of convert baptisms from 102 years prior to 50 years prior for the third addendum. The sum of these groups must then be multiplied by the inactivity rate to estimate number of inactives who reach 110 years. The rate of name removal, which will be discussed in the next section, is then removed from the result in order to account for individuals who are no longer on the records of the LDS church. The final result is shown in Figure 6a: 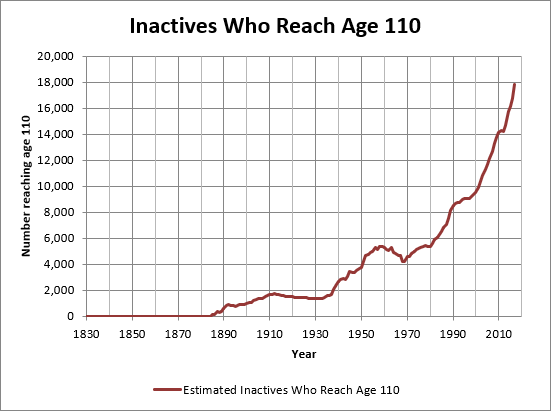
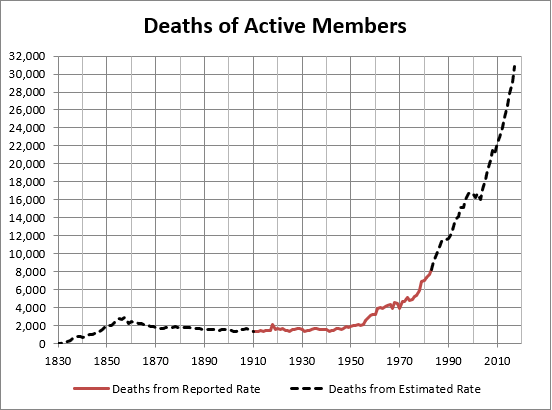
Definition: The number of individuals whose names have been removed from church records, for all reasons not limited to apostasy. Using known increase in membership, increase due to births, increase due to convert children of record, increase due to convert baptisms, and decrease due to active members who die and inactives who reach age 110, the remainder can be calculated and assumed to be number of names removed from church records. (Note that in the figure below, increase and decrease are represented similarly, whereas the computed number balance subtracts one from the other) 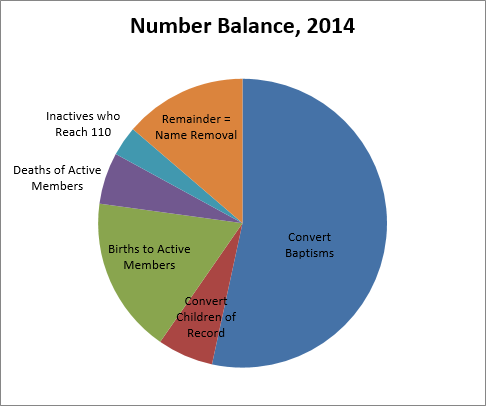
This book, as well as other investigations, such as this and this, indicate that sometime, probably in the 1980's, the LDS church switched from counting 8-year-olds baptized as members to counting all children of record, including those under the age of 8, as members. The effect of such a switch would be a sudden otherwise-inexplicable increase in total membership as all existing children of record under the age of 8 were added at once. A sudden increase of this sort, in fact, is observed in the years 1989 and 1990, where approximately 250,000 individuals were inexplicably added to the membership totals. As it turns out, this figure is very close to the estimated number of active children of record generated in the preceding 8 years. Therefore, it is assumed that prior to 1989, children of record baptisms are to be used in the number balance, and from 1989 to the present children of record are to be used, with the estimated number of children of record from the preceding eight years added for the years 1989 and 1990. Because the number of convert baptisms prior to 1859 is unknown, an assumption must be made. It is assumed that, because the rate of name removal has generally tended to be near 0.4556% of total membership, this proportion can be assumed prior to 1859 as well, with manual adjustments which are necessary in cases where the number balance causes the convert baptisms to fall below zero. 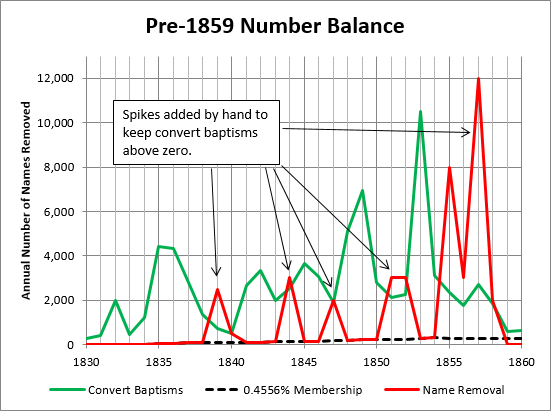
Record Adjustments When name removal, calculated above, is plotted on a graph from 1830 to 2015, it looks like Figure 8a: 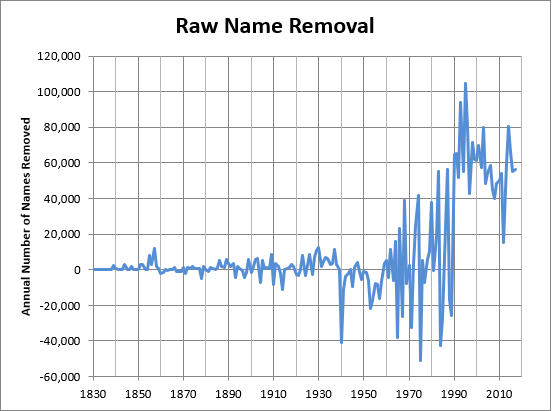
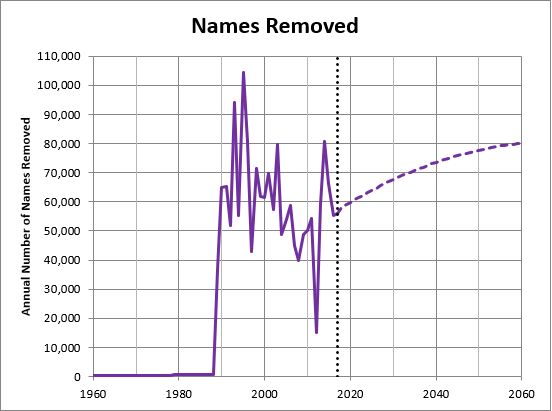
The negative values reflect years in which records were apparently added outside of baptisms and children of record. Before the Internet, membership was reported annually to church headquarters via telephone and/or post mail, which likely created room for error due to communication issues and/or inconsistency in reporting methods. It is therefore likely that before the late 90's reported membership totals fluctuated up and down on a year-to-year basis. Assuming that the overall net loss and recovery of reported records is equal to zero, rough record adjustments can be estimated by hand to account for these fluctuations. It is observed that prior to 1989 the average number of record removals was very close to zero. That was the year in which a new version of the General Handbook of Instructions was released which allowed for members to resign their membership from the church without facing a church court, in response to a lawsuit brought against the church by Norman Hancock a few years earlier. This is almost certainly the reason for the sharp increase in name removals at that time. The only year prior to 1989 for which we have found a number of name removals is this source for 1913, which lists "excommunications" as 55 for that year. This was approximately 0.013% of the total membership for that year. This ratio is assumed for all years from 1859 (the year in which membership growth stabilized) to 1989. Manual correction are applied to these estimates with an overall cumulative correction of zero in order to preserve conservation of individuals. The result is shown in figure 8b: 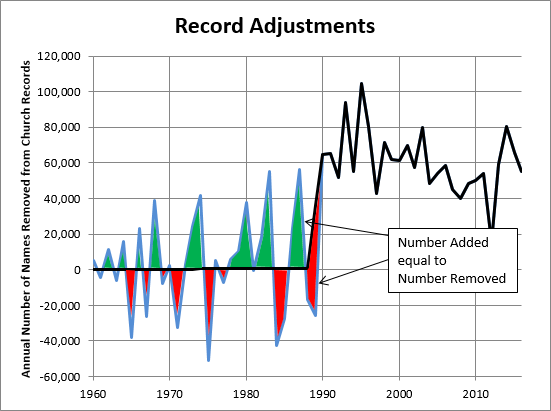
In 2001 an anonymous source in the Church Office Building leaked the number of names removed from church records from 1995 to 2000. This information was published on Richard Packham's web page. Two years later the figures for 2001 and 2002 were leaked and posted on the same page, also from an anonymous source. As this source can not be corroborated it must be taken with a grain of salt. However, when plotted against the results of our analysis below in Figure 8c, it does appear to fall within the same order of magnitude, which lends credibility to our estimates. In late 2016 a friend of a friend of an anonymous source posted in a private Facebook group that the church was processing 7,000 to 8,000 resignations per month. This is roughly equivalent to about 90,000 resignations per year, but is expected to be higher than the total for the year, since it is expected that the leak, if it is to be trusted at all, would have been given during an unusually high month. The estimated number of name removals according to our methodology was 55,252 in 2016. The leaked figures serve only as a check against our methodology, and are not used in the calculations or methodology in any way. The corrected name removal values overlaid by the leaked figures, as well as the 1913 reported figure, are shown in Figure 8c: 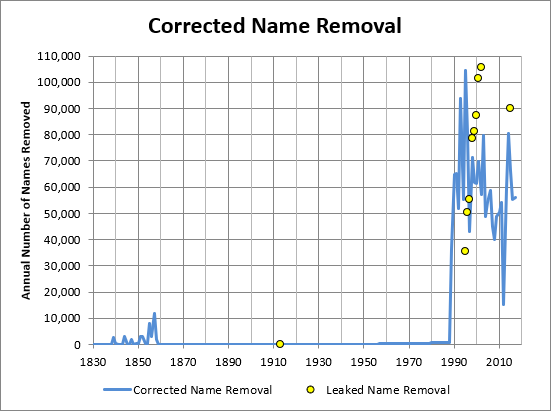
Entrance/Exit Trends When all the data are put together and divided by total annual church membership, trends on how people enter and exit the church each year can be assessed. This yields Figure 9a: 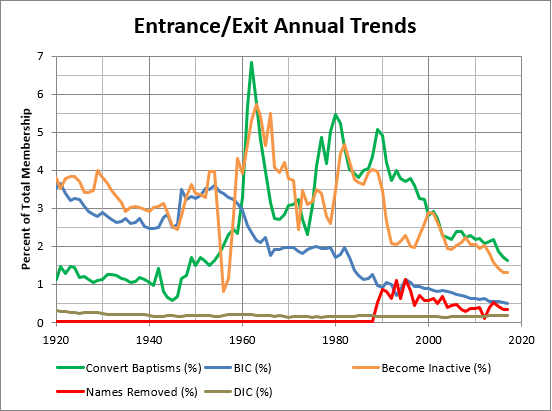
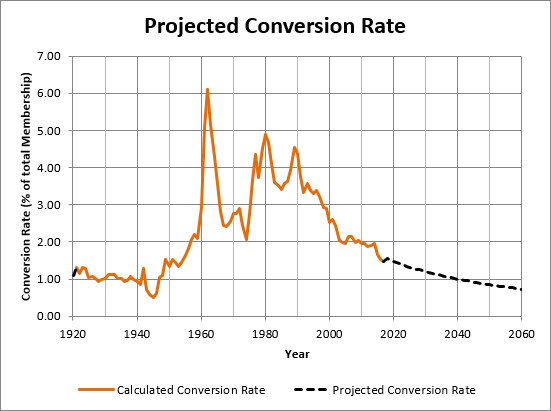
Future Projections To make projections of membership trends, assumptions need to be made regarding convert baptisms, birth rate, life expectancy, activity rate, and names removed in the future. All other values can be computed using the methods outlined above. Because the future can not be known with a high degree of certainty, for the purposes of this study it is assumed that future trends will be a continuation of recent trends. Projected Convert BaptismsAs seen in Figure 1c, the rate of convert baptisms versus overall membership has been far from constant in recent years. However, the total number of convert baptisms has generally fallen since the late 1980's / early 1990's. A best fit analysis of these data yields a linear conversion trend, shown in Figure 10a, which in turn yields a non-linear conversion rate that appears to be a continuation of recent trends, and is shown in Figure 10b. 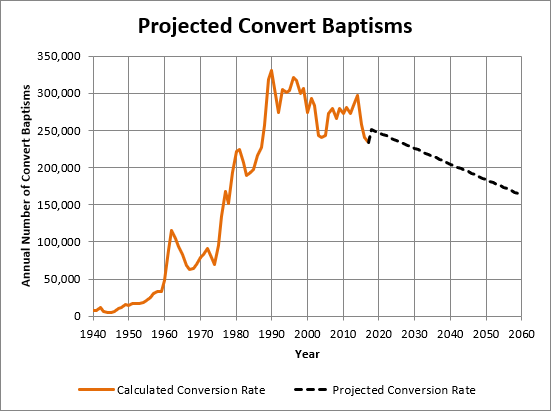
Projected Birth Rate On average, in recent years the Mormon birth rate, assumed to be equal to the Utah birth rate, has been 1.37 times the United States birth rate. Using projected U.S. birth rates up to 2060, estimated by the Center for Disease Control (CDC), the Mormon birth rate can be estimated, which yields Figure 10c: 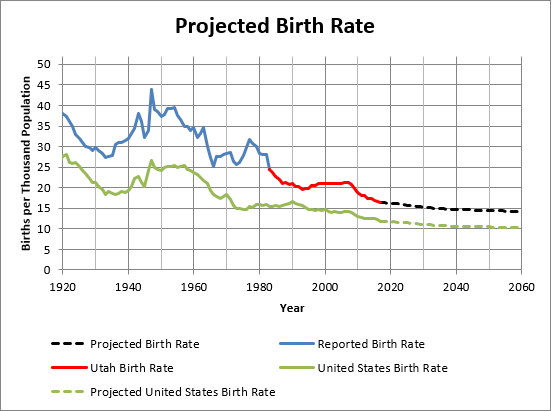
Projected Life Expectancy Neither the Mormon life expectancy since 2004 nor the rate at which it is increasing or decreasing is known with any amount of certainty. Fortunately this variable is not expected to be very sensitive towards the overall results, but an assumption must be made. For the purposes of this study it is assumed that Mormon life expectancy is 83 years in 2015, and increases by 0.05 years annually until it reaches the value of 85.2 in the year 2060. This is shown in Figure 10d: 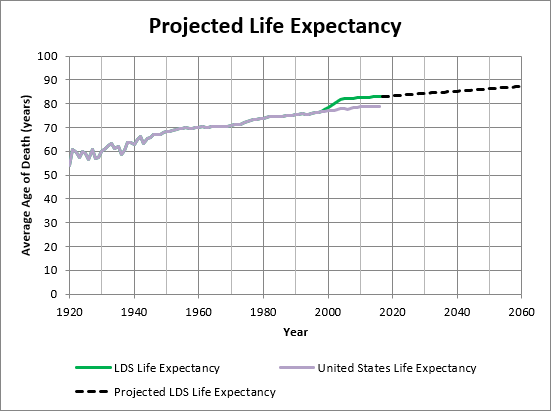
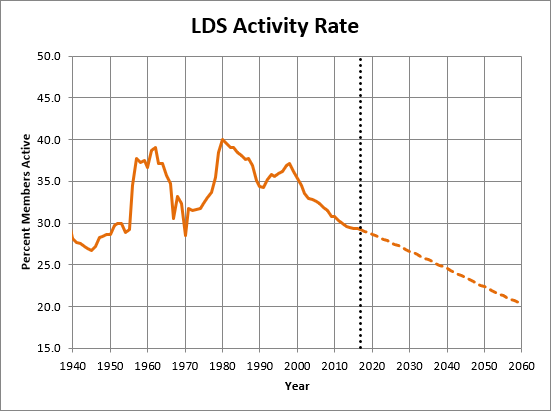
Projected Activity Rate The LDS activity rate has been falling steadily since peaking in 1998. While it is not expected that any form of regression will produce the best results, it is noted that in Figure 9a in the previous section above, the number of individuals becoming inactive each year tends to track very closely with the number of convert baptisms each year. In fact, on average the number of people becoming inactive is approximately 90% of the number of convert baptisms for any given year. Using this assumption, and the projected number of convert baptisms above, the number of inactive members each year can be projected, and divided by projected total membership to get activity rates. However, this results in a circular function, as the activity rate is required to estimate reported deaths, which is required to estimate the total membership. However, when this circular reference is repeated to convergence, it is noted that the activity rate is projected to fall by an average of 0.155% each year until 2060. So, in order to avoid a circular reference, an approximate method is used in this analysis where the projected activity rate is computed using 90% of convert baptisms to estimate inactives for the previous year, and 0.155% is subtracted from that prior year value. Projected activity rates computed thus are shown in Figure 10e: 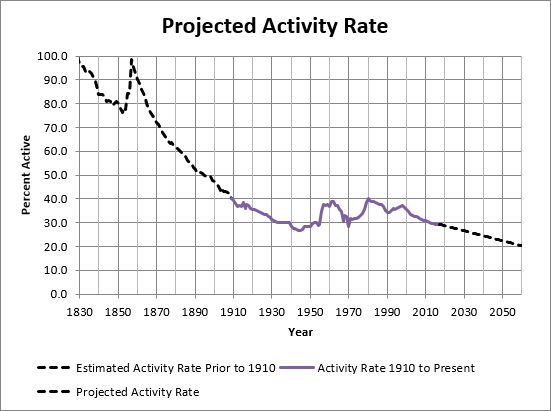
Projected Names Removed It is nearly impossible to anticipate the number of future names removed. However, this value can be estimated assuming a typical recent name removal rate of 0.36% of the projected total church membership for each given year. The result is shown in Figure 10f: 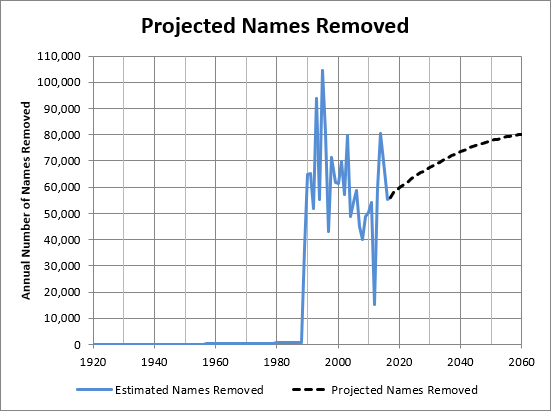
Based on these assumptions, the future trends until 2060 are expected to be as shown in the main figures at the top of this page. |